Hello guys!
How have you been? I apologize for not being relatively active in the blog in the recent past. But the good news is today I am going to write about another lesson on Yahoo Finance, in the series of learning how to use Yahoo Finance for your investment purposes.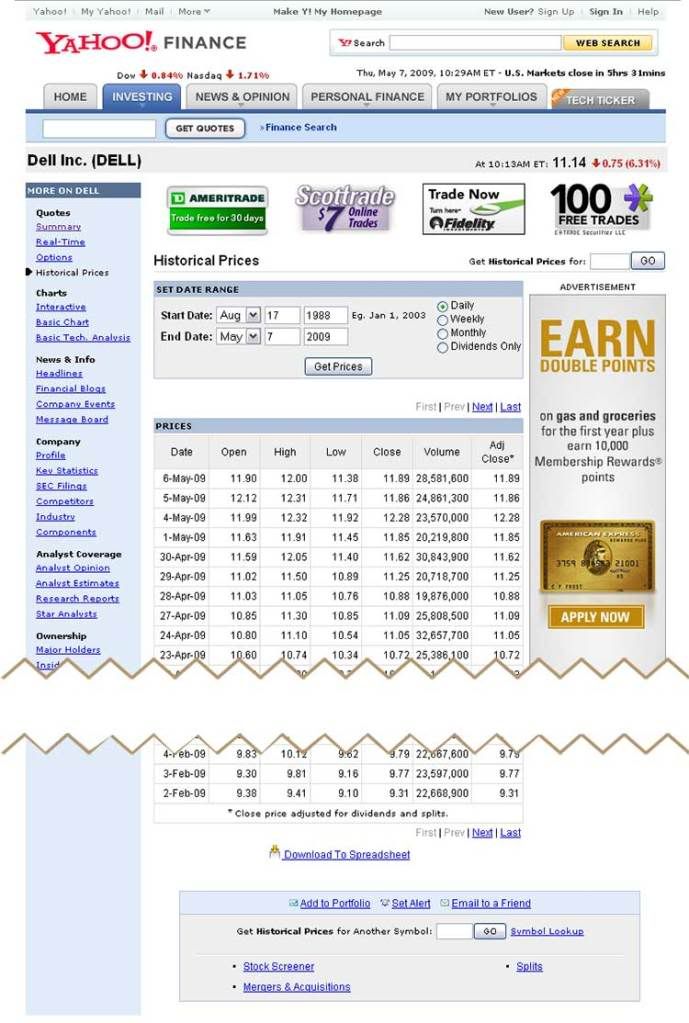
As you can see in the picture, we are talking today about Historical Prices section in the yahoo finance. Just like an eleven year old can tell you, its the past values for a stock.
In this section you can set your own date range for a company's stock on Daily, Weekly, Monthly, or Dividends only basis. One important thing to mention in here is that prices listed here are end of the day prices and they are already adjusted for Dividend and Stock split.
At the bottom of the page you have the opportunity to download this data set to an Excel compatible file.
So thats all on Historical Prices section on Yahoo Finance.
Learn Yahoo Finance
Learn to use Yahoo Finance: part 3
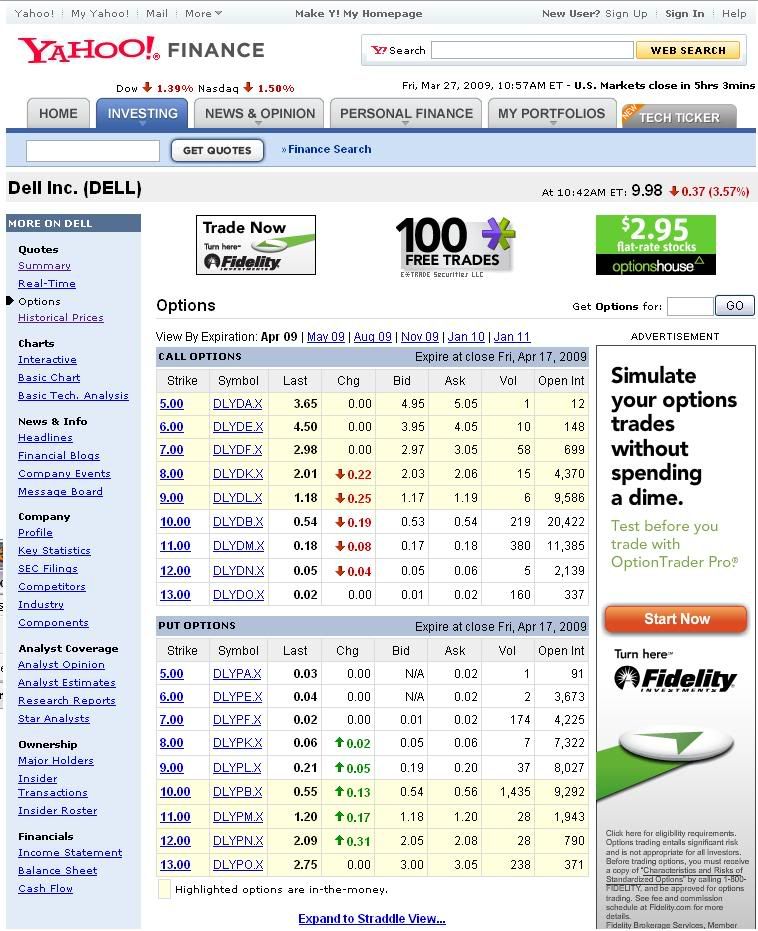
In this post we look as Options section under Quotes. Call option is in which the Buyer of the security has the right but not the obligation to buy the securities at a set price or exercise price at a certain time. Put option is exactly the opposite; the sellers side. And the Bid price is how much the buyer is willing to pay to buy the option. Just like previous Ask is the exact opposite.
Alright with that preliminary understanding lets look at the Options page of Yahoo finance. Yet again we look at Dell stock.
"View by expiration" is when the option expires.
Both the Call and Put option have similar information, so lets look at the Call option.
Strike - is the price at which the option is exercised. In the case of Call option, if you buy the option and the price of the security goes up, our strategy to make the best profit is exercise the Call option and buy the security at $5.00 (Strike price) and sell it on market for higher.
Symbol - has the symbols of all the different options with different values.
Bid - is the price the seller of the option would get.
Ask - is the price the buyer of the option would receive to purchase the option.
Vol - represent the number of those options available.
Open Int - "The total number of options and/or futures contracts that are not closed or delivered on a particular day. Or the number of buy market orders before the stock market opens." - investopedia.com
In this blog post we talked about Options section in yahoo finance -call and put options. And we went over what each column of the page means to an investor or a trader.
Learn to use Yahoo Finance, Part 2
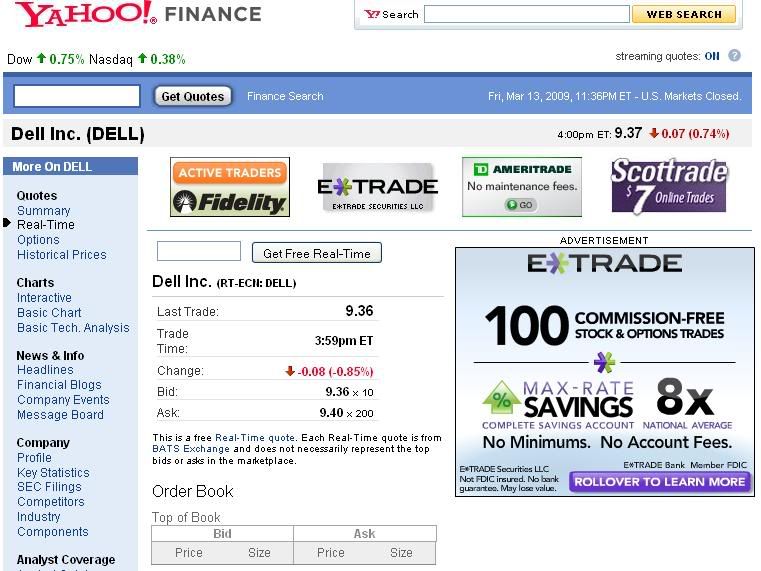
Today's post we look at Real-Time section under the Quotes section on Yahoo finance left-side panel. Just as the word goes, this section shows you the real-time trading prices for a stock. In this example I have used Dell stock.
In this case last traded price of Dell stock was $9.36 right before the stock market closed at 4pm on Friday. It also shows the percentage change of the stock for the day and bid and ask prices.
Bottom also contain the block book of bid and ask prices list. Unfortunately in this example as the market was close the real-time trading prices were not shown in here.
That is all for todays yahoo finance, join ashPresentom next time for more educational blog posts on the yahoo finance.
Learn to use Yahoo Finance: part 1
Yahoo finance is a real-time stock market display website. This site is used mostly for college level finance classes as well as investment classes. If you signed up with a yahoo.com email address it will let you pick stocks and develop your own portfolio and watch the performance. This site is only for displaying of market-performance and not for trading securities.
Today's blog post I will introduce what each of the terms reflect in yahoo finance website.
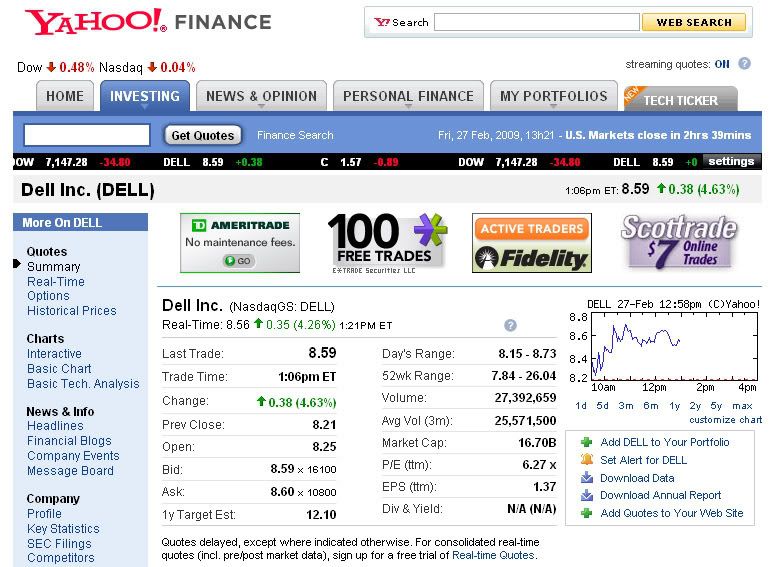
On top left, shows the real-time DOW Jones and Nasdaq index's percentage changes for today.
For demonstrate the layout of Yahoo Finance, I pulled out Dell Inc stock.
Last Trade: is the price or the value of a share of Dell for the trade time mentioned in the line below.
Change; reflect the percentage change of share price from the starting share price of Dell stock.
Prev. Close; is the last share price at which Dell stock was closed the day before.
Open, is the price at which it was open today.
Bid and Ask; Ask price is always higher than Bid price, which means if an investor to buy a Dell stock he would pay the Ask price, and if you sell a stock you will get Bid price. The difference between Bid and Ask price is called the Spread and is kept as profit by the broker.
1yr Target Est, is the estimated price of the Dell stock in 1 year from now.
Day's Range, shows the total fluctuation of the stock price of Dell for the day. The line below that is 52 weeks combined range of price fluctuation. This will give a potential buyer of Delll stock an idea of how high the stock price has been over last 52 weeks, as well as how low is has been.
Volume is the number of shares trading at the moment. This is also the number of outstanding shares of Dell, which is less than the Authorized shares. And companies will not always sell all their authorized shares.
Next Lines, Avg Vol (3m): average volume of shares traded over past three months.
Market cap, or market capitalization is a quick way to estimate the value of a company. Also is the Stock Price x Number of outstanding stocks. Roughly, if market cap is larger than $5 Billion is it called "Large Cap", $1-5 Billion is "Mid Cap", and $1 Billion or less being the "Small Cap".
P/E(ttm), in general P/E is the Earnings Yeild, price of a share relative to its earnings, which gives a percentage return metric. In ttm basis, means the current market price is divided by "Trainling twelve month" earnings per share. This look at the past 4 Quarters of earnings for Dell.
EPS (ttm), once again looking 4 Quarters back for the earnings per share.
And the last line "Div & Yield" is past divident payments.
Also the graph on the right side shows days progress of Dell Inc.. Stock price in a graphic format. Below the graph you can see "1d 5d 3m ..." clicking these each will display and explicit graph for the selected period of time. For some investors looking at a graph tells more than numerical values. In the next topic I wish to cover other components on Yahoo Finance real-time stock viewer website. Please feel free to flood the comments with your feedbacks and questions.
Search

Bookmark and Subscribe to ashPresentom